I. Titanic Transcription
II. Kaggle KPI 설치
Google Colab에서 Kaggle API를 불러오려면 다음 소스코드를 실행한다.
Requirement already satisfied: kaggle in /usr/local/lib/python3.6/dist-packages (1.5.9)
Requirement already satisfied: slugify in /usr/local/lib/python3.6/dist-packages (from kaggle) (0.0.1)
Requirement already satisfied: tqdm in /usr/local/lib/python3.6/dist-packages (from kaggle) (4.41.1)
Requirement already satisfied: requests in /usr/local/lib/python3.6/dist-packages (from kaggle) (2.23.0)
Requirement already satisfied: python-dateutil in /usr/local/lib/python3.6/dist-packages (from kaggle) (2.8.1)
Requirement already satisfied: certifi in /usr/local/lib/python3.6/dist-packages (from kaggle) (2020.6.20)
Requirement already satisfied: urllib3 in /usr/local/lib/python3.6/dist-packages (from kaggle) (1.24.3)
Requirement already satisfied: six>=1.10 in /usr/local/lib/python3.6/dist-packages (from kaggle) (1.15.0)
Requirement already satisfied: python-slugify in /usr/local/lib/python3.6/dist-packages (from kaggle) (4.0.1)
Requirement already satisfied: idna<3,>=2.5 in /usr/local/lib/python3.6/dist-packages (from requests->kaggle) (2.10)
Requirement already satisfied: chardet<4,>=3.0.2 in /usr/local/lib/python3.6/dist-packages (from requests->kaggle) (3.0.4)
Requirement already satisfied: text-unidecode>=1.3 in /usr/local/lib/python3.6/dist-packages (from python-slugify->kaggle) (1.3)
III. Kaggle Token 다운로드
Kaggle에서 API Token을 다운로드 받는다.
[Kaggle]-[My Account]-[API]-[Create New API Token]을 누르면 kaggle.json 파일이 다운로드 된다.
이 파일을 바탕화면에 옮긴 뒤, 아래 코드를 실행 시킨다.
Part1 : Exploratory Data Analysis(EDA) 1 2 3 4 5 6 7 8 from google.colab import filesuploaded = files.upload() for fn in uploaded.keys(): print('uploaded file "{name}" with length {length} bytes' .format ( name=fn, length=len (uploaded[fn]))) !mkdir -p ~/.kaggle/ && mv kaggle.json ~/.kaggle/ && chmod 600 ~/.kaggle/kaggle.json
Saving kaggle.json to kaggle.json
uploaded file "kaggle.json" with length 68 bytes1 ls -1 ha ~/.kaggle/kaggle.json
/root/.kaggle/kaggle.json
에러 메시지가 없으면 성공적으로 json 파일이 업로드 되었다는 뜻이다.
IV. Kaggle 데이터 불러오기
먼저 kaggle competition list를 불러온다.
1 !kaggle competitions list
Warning: Looks like you're using an outdated API Version, please consider updating (server 1.5.9 / client 1.5.4)
ref deadline category reward teamCount userHasEntered
--------------------------------------------- ------------------- --------------- --------- --------- --------------
contradictory-my-dear-watson 2030-07-01 23:59:00 Getting Started Prizes 134 False
gan-getting-started 2030-07-01 23:59:00 Getting Started Prizes 186 False
tpu-getting-started 2030-06-03 23:59:00 Getting Started Knowledge 317 False
digit-recognizer 2030-01-01 00:00:00 Getting Started Knowledge 2373 False
titanic 2030-01-01 00:00:00 Getting Started Knowledge 18236 True
house-prices-advanced-regression-techniques 2030-01-01 00:00:00 Getting Started Knowledge 4579 True
connectx 2030-01-01 00:00:00 Getting Started Knowledge 395 False
nlp-getting-started 2030-01-01 00:00:00 Getting Started Knowledge 1190 False
rock-paper-scissors 2021-02-01 23:59:00 Playground Prizes 209 False
riiid-test-answer-prediction 2021-01-07 23:59:00 Featured $100,000 1483 False
nfl-big-data-bowl-2021 2021-01-05 23:59:00 Analytics $100,000 0 False
competitive-data-science-predict-future-sales 2020-12-31 23:59:00 Playground Kudos 9358 False
halite-iv-playground-edition 2020-12-31 23:59:00 Playground Knowledge 44 False
predict-volcanic-eruptions-ingv-oe 2020-12-28 23:59:00 Playground Swag 195 False
hashcode-drone-delivery 2020-12-14 23:59:00 Playground Knowledge 80 False
cdp-unlocking-climate-solutions 2020-12-02 23:59:00 Analytics $91,000 0 False
lish-moa 2020-11-30 23:59:00 Research $30,000 3431 False
google-football 2020-11-30 23:59:00 Featured $6,000 921 False
conways-reverse-game-of-life-2020 2020-11-30 23:59:00 Playground Swag 131 False
lyft-motion-prediction-autonomous-vehicles 2020-11-25 23:59:00 Featured $30,000 784 False titanic 데이터를 불러온다.
1 !kaggle competitions download -c titanic
Warning: Looks like you're using an outdated API Version, please consider updating (server 1.5.9 / client 1.5.4)
test.csv: Skipping, found more recently modified local copy (use --force to force download)
train.csv: Skipping, found more recently modified local copy (use --force to force download)
gender_submission.csv: Skipping, found more recently modified local copy (use --force to force download)ls 로 경로 내 모든 데이터 파일을 확인한다.
gender_submission.csv sample_data test.csv train.csv(1) 데이터 수집
지난 시간에 받은 데이터가 총 4개임을 확인했다.
data_description.txt
sample_submission.csv
test.csv
train.csv
여기에서는 우선 test.csv & train.csv 파일을 받도록 한다.
1 2 3 4 5 6 7 8 import numpy as np import pandas as pd import matplotlib.pyplot as plt import seaborn as sns plt.style.use('fivethirtyeight' ) import warningswarnings.filterwarnings('ignore' ) %matplotlib inline
train 데이터를 불러와서 data로 넣어주자
1 data= pd.read_csv('train.csv' )
PassengerId
Survived
Pclass
Name
Sex
Age
SibSp
Parch
Ticket
Fare
Cabin
Embarked
0
1
0
3
Braund, Mr. Owen Harris
male
22.0
1
0
A/5 21171
7.2500
NaN
S
1
2
1
1
Cumings, Mrs. John Bradley (Florence Briggs Th...
female
38.0
1
0
PC 17599
71.2833
C85
C
2
3
1
3
Heikkinen, Miss. Laina
female
26.0
0
0
STON/O2. 3101282
7.9250
NaN
S
3
4
1
1
Futrelle, Mrs. Jacques Heath (Lily May Peel)
female
35.0
1
0
113803
53.1000
C123
S
4
5
0
3
Allen, Mr. William Henry
male
35.0
0
0
373450
8.0500
NaN
S
PassengerId 0
Survived 0
Pclass 0
Name 0
Sex 0
Age 177
SibSp 0
Parch 0
Ticket 0
Fare 0
Cabin 687
Embarked 2
dtype: int64Age와 Cabin에 결측값이 있는 것을 확인했다. 나는 이들을 고치도록 노력할 것이다.
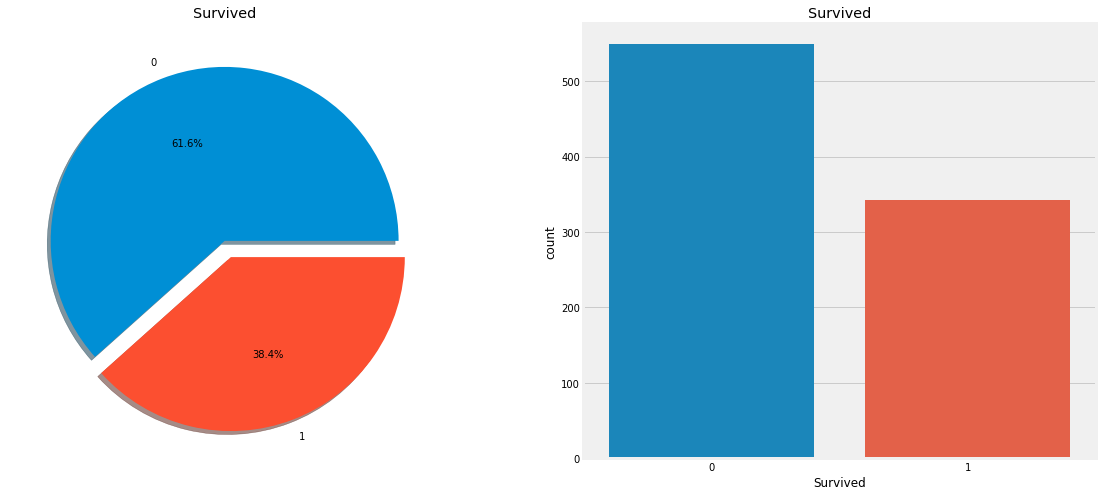
얼마나 살아남았는가?
1 2 3 4 5 6 7 f,ax=plt.subplots(1 ,2 ,figsize=(18 ,8 )) data['Survived' ].value_counts().plot.pie(explode=[0 ,0.1 ], autopct='%1.1f%%' ,ax=ax[0 ],shadow=True ) ax[0 ].set_title('Survived' ) ax[0 ].set_ylabel('' ) sns.countplot('Survived' ,data=data,ax=ax[1 ]) ax[1 ].set_title('Survived' ) plt.show()
특징 분석
sex -> Categorical Feature
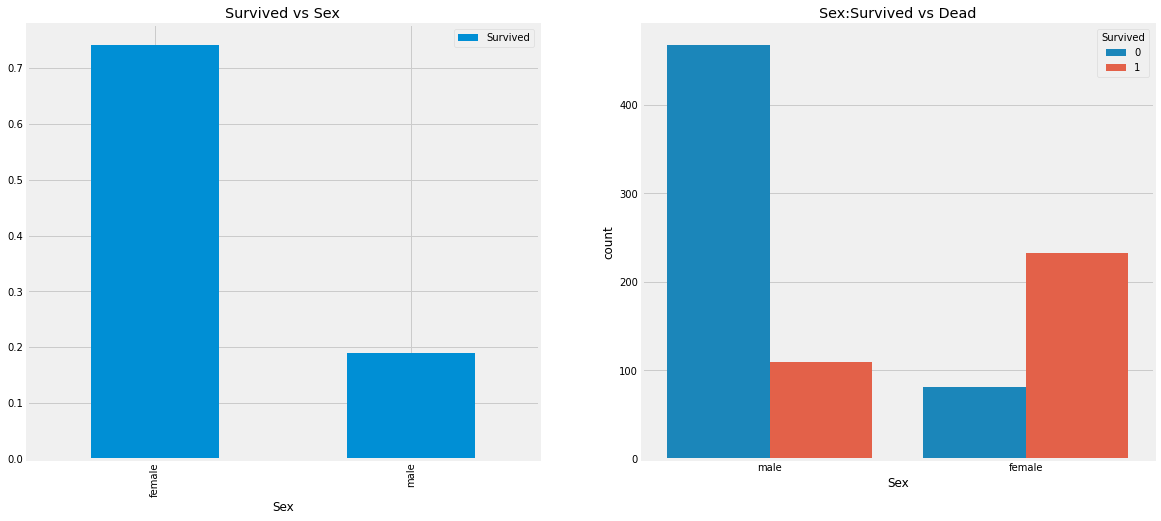
1 data.groupby(['Sex' , 'Survived' ])['Survived' ].count()
Sex Survived
female 0 81
1 233
male 0 468
1 109
Name: Survived, dtype: int641 2 3 4 5 6 f,ax=plt.subplots(1 ,2 ,figsize=(18 ,8 )) data[['Sex' , 'Survived' ]].groupby(['Sex' ]).mean().plot.bar(ax=ax[0 ]) ax[0 ].set_title('Survived vs Sex' ) sns.countplot('Sex' , hue='Survived' , data=data,ax=ax[1 ]) ax[1 ].set_title('Sex:Survived vs Dead' ) plt.show()
배에 타고 있는 남성의 숫자가 훨씬 많은 반면 구조된 여성의 수는 구조된 남성의 수보다 거의 두배나 많다. 배에 타고 있는 여성의 생존율을 약 75%인 반면 남성은 약 18~19%이다. 이것은 모델링을 위해 매우 중요한 특징으로 보인다. 하지만 그게 최고일까? 다른 기능을 확인해보자.
1 pd.crosstab(data.Pclass, data.Survived, margins=True ). style.background_gradient(cmap='summer_r' )
Survived 0 1 All Pclass
<tr>
<th id="T_bd663c72_1ebd_11eb_af08_0242ac1c0002level0_row0" class="row_heading level0 row0" >1</th>
<td id="T_bd663c72_1ebd_11eb_af08_0242ac1c0002row0_col0" class="data row0 col0" >80</td>
<td id="T_bd663c72_1ebd_11eb_af08_0242ac1c0002row0_col1" class="data row0 col1" >136</td>
<td id="T_bd663c72_1ebd_11eb_af08_0242ac1c0002row0_col2" class="data row0 col2" >216</td>
</tr>
<tr>
<th id="T_bd663c72_1ebd_11eb_af08_0242ac1c0002level0_row1" class="row_heading level0 row1" >2</th>
<td id="T_bd663c72_1ebd_11eb_af08_0242ac1c0002row1_col0" class="data row1 col0" >97</td>
<td id="T_bd663c72_1ebd_11eb_af08_0242ac1c0002row1_col1" class="data row1 col1" >87</td>
<td id="T_bd663c72_1ebd_11eb_af08_0242ac1c0002row1_col2" class="data row1 col2" >184</td>
</tr>
<tr>
<th id="T_bd663c72_1ebd_11eb_af08_0242ac1c0002level0_row2" class="row_heading level0 row2" >3</th>
<td id="T_bd663c72_1ebd_11eb_af08_0242ac1c0002row2_col0" class="data row2 col0" >372</td>
<td id="T_bd663c72_1ebd_11eb_af08_0242ac1c0002row2_col1" class="data row2 col1" >119</td>
<td id="T_bd663c72_1ebd_11eb_af08_0242ac1c0002row2_col2" class="data row2 col2" >491</td>
</tr>
<tr>
<th id="T_bd663c72_1ebd_11eb_af08_0242ac1c0002level0_row3" class="row_heading level0 row3" >All</th>
<td id="T_bd663c72_1ebd_11eb_af08_0242ac1c0002row3_col0" class="data row3 col0" >549</td>
<td id="T_bd663c72_1ebd_11eb_af08_0242ac1c0002row3_col1" class="data row3 col1" >342</td>
<td id="T_bd663c72_1ebd_11eb_af08_0242ac1c0002row3_col2" class="data row3 col2" >891</td>
</tr>
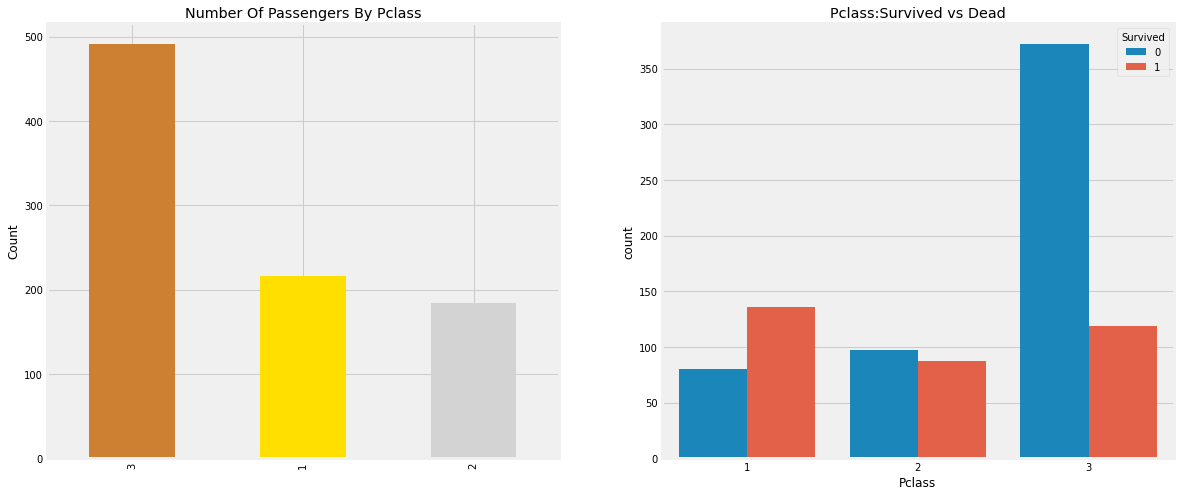
</tbody></table>1 2 3 4 5 6 7 8 f,ax=plt.subplots(1 ,2 ,figsize=(18 ,8 )) data['Pclass' ].value_counts().plot.bar(color=['#CD7F32' ,'#FFDF00' ,'#D3D3D3' ],ax=ax[0 ]) ax[0 ].set_title('Number Of Passengers By Pclass' ) ax[0 ].set_ylabel('Count' ) sns.countplot('Pclass' , hue= 'Survived' , data=data, ax=ax[1 ]) ax[1 ].set_title('Pclass:Survived vs Dead' ) plt.show()
우리는 돈이 모든 것을 살 수 없다 말하지만 위 데이터를 보면 높은 등급의 객실 사람들 일수록 더 높은 생존률을 보이는 것을 알 수 있다.
이제는 성별과 객실 등급을 함께 확인해보자.
1 2 pd.crosstab([data.Sex, data.Survived], data.Pclass, margins=True ).style.background_gradient(cmap='summer_r' )
Pclass 1 2 3 All Sex Survived
<tr>
<th id="T_bd9cba4a_1ebd_11eb_af08_0242ac1c0002level0_row0" class="row_heading level0 row0" rowspan=2>female</th>
<th id="T_bd9cba4a_1ebd_11eb_af08_0242ac1c0002level1_row0" class="row_heading level1 row0" >0</th>
<td id="T_bd9cba4a_1ebd_11eb_af08_0242ac1c0002row0_col0" class="data row0 col0" >3</td>
<td id="T_bd9cba4a_1ebd_11eb_af08_0242ac1c0002row0_col1" class="data row0 col1" >6</td>
<td id="T_bd9cba4a_1ebd_11eb_af08_0242ac1c0002row0_col2" class="data row0 col2" >72</td>
<td id="T_bd9cba4a_1ebd_11eb_af08_0242ac1c0002row0_col3" class="data row0 col3" >81</td>
</tr>
<tr>
<th id="T_bd9cba4a_1ebd_11eb_af08_0242ac1c0002level1_row1" class="row_heading level1 row1" >1</th>
<td id="T_bd9cba4a_1ebd_11eb_af08_0242ac1c0002row1_col0" class="data row1 col0" >91</td>
<td id="T_bd9cba4a_1ebd_11eb_af08_0242ac1c0002row1_col1" class="data row1 col1" >70</td>
<td id="T_bd9cba4a_1ebd_11eb_af08_0242ac1c0002row1_col2" class="data row1 col2" >72</td>
<td id="T_bd9cba4a_1ebd_11eb_af08_0242ac1c0002row1_col3" class="data row1 col3" >233</td>
</tr>
<tr>
<th id="T_bd9cba4a_1ebd_11eb_af08_0242ac1c0002level0_row2" class="row_heading level0 row2" rowspan=2>male</th>
<th id="T_bd9cba4a_1ebd_11eb_af08_0242ac1c0002level1_row2" class="row_heading level1 row2" >0</th>
<td id="T_bd9cba4a_1ebd_11eb_af08_0242ac1c0002row2_col0" class="data row2 col0" >77</td>
<td id="T_bd9cba4a_1ebd_11eb_af08_0242ac1c0002row2_col1" class="data row2 col1" >91</td>
<td id="T_bd9cba4a_1ebd_11eb_af08_0242ac1c0002row2_col2" class="data row2 col2" >300</td>
<td id="T_bd9cba4a_1ebd_11eb_af08_0242ac1c0002row2_col3" class="data row2 col3" >468</td>
</tr>
<tr>
<th id="T_bd9cba4a_1ebd_11eb_af08_0242ac1c0002level1_row3" class="row_heading level1 row3" >1</th>
<td id="T_bd9cba4a_1ebd_11eb_af08_0242ac1c0002row3_col0" class="data row3 col0" >45</td>
<td id="T_bd9cba4a_1ebd_11eb_af08_0242ac1c0002row3_col1" class="data row3 col1" >17</td>
<td id="T_bd9cba4a_1ebd_11eb_af08_0242ac1c0002row3_col2" class="data row3 col2" >47</td>
<td id="T_bd9cba4a_1ebd_11eb_af08_0242ac1c0002row3_col3" class="data row3 col3" >109</td>
</tr>
<tr>
<th id="T_bd9cba4a_1ebd_11eb_af08_0242ac1c0002level0_row4" class="row_heading level0 row4" >All</th>
<th id="T_bd9cba4a_1ebd_11eb_af08_0242ac1c0002level1_row4" class="row_heading level1 row4" ></th>
<td id="T_bd9cba4a_1ebd_11eb_af08_0242ac1c0002row4_col0" class="data row4 col0" >216</td>
<td id="T_bd9cba4a_1ebd_11eb_af08_0242ac1c0002row4_col1" class="data row4 col1" >184</td>
<td id="T_bd9cba4a_1ebd_11eb_af08_0242ac1c0002row4_col2" class="data row4 col2" >491</td>
<td id="T_bd9cba4a_1ebd_11eb_af08_0242ac1c0002row4_col3" class="data row4 col3" >891</td>
</tr>
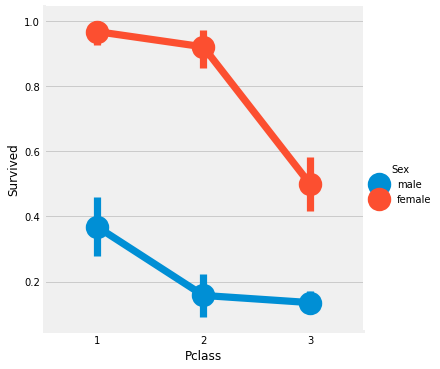
</tbody></table>1 2 sns.factorplot('Pclass' , 'Survived' , hue='Sex' , data=data) plt.show()
우리는 1등급 객실의 여성 생존률이 95~96%인 것을 알 수 있다. 94명 중에 고작 3명 밖에 안죽었다. 남성과의 비교를 통해 객실의 관계없이 구조하는 동안 여성에게 우선권이 주어졌다는 것은 명백하다. 심지어 1등급 객실에서도 남성들의 생존율이 매우 낮다.
이를 통해 객실등급이 중요한 특성이라는 것을 확인할 수 있었다. 다른 특성을 확인해보자.
나이 특징
1 2 3 4 print('Oldest Passenger was of :' , data['Age' ].max (),'Years' ) print('Youngest Passenger was of :' , data['Age' ].min (),'Years' ) print('Average Age on the ship :' , data['Age' ].mean(),'Years' )
Oldest Passenger was of : 80.0 Years
Youngest Passenger was of : 0.42 Years
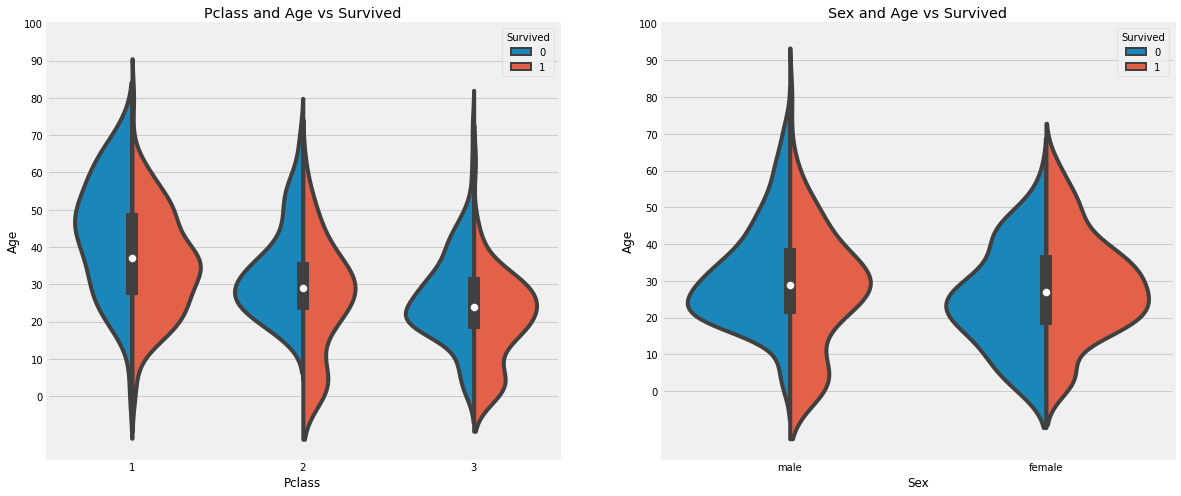
Average Age on the ship : 29.69911764705882 Years1 2 3 4 5 6 7 8 f,ax=plt.subplots(1 ,2 ,figsize=(18 ,8 )) sns.violinplot("Pclass" ,"Age" , hue="Survived" , data=data,split=True , ax=ax[0 ]) ax[0 ].set_title("Pclass and Age vs Survived" ) ax[0 ].set_yticks(range (0 ,110 ,10 )) sns.violinplot("Sex" , "Age" , hue="Survived" , data = data, split=True , ax=ax[1 ]) ax[1 ].set_title('Sex and Age vs Survived' ) ax[1 ].set_yticks(range (0 ,110 ,10 )) plt.show()
관찰결과)
객실 등급에 따라 자녀 수가 증가하고 10세 미만의 승객 생존률은 객실 등급에 관계없이 양호한 것으로 보인다.
1등급 객실에서 20~50세 승객의 생존 가능성은 높고 여성에게는 더욱 좋다.
남성의 경우 나이가 많을 수록 생존가능성은 줄어든다.
우리는 이전에 Age 177개의 결측값이 있던 것을 확인했다. 우리는 여기에 평균값을 넣어줄 수 있다.
하지만 우리는 이 때 나이가 적거나 낮은 사람에게 적절하지 않은 평균을 넣으면 문제가 생길 수 있다는 것을 알고있다. 그러면 고객의 연령대를 예측할 수 있는 방법은 없을까?
있다! 우리는 승객 이름의 특징을 확인할 수 있다. 우리는 승객들의 이름에 Mr 또는 Mrs등의 특징이 있다는 것을 알수 있다. 따라서 우리는 Mr, Mrs의 평균값을 각 그룹에 할당할 수 있다.
이름에 무엇이 붙는 가 특징!!
1 2 3 data['Initial' ]=0 for i in data: data['Initial' ]=data.Name.str .extract('([A-Za-z]+)\.' )
자, 이제 Regex를 사용합시다. A-Z 또는 a-z사이에 있는 문자열을 찾고, 그 뒤에 .(점)이 있는 문자열을 찾는 겁니다. 그래서 우리는 이름에서 이니셜을 성공적으로 추출했다.
1 2 pd.crosstab(data.Initial, data.Sex).T.style.background_gradient(cmap='summer_r' )
Initial Capt Col Countess Don Dr Jonkheer Lady Major Master Miss Mlle Mme Mr Mrs Ms Rev Sir Sex
<tr>
<th id="T_be2cfb00_1ebd_11eb_af08_0242ac1c0002level0_row0" class="row_heading level0 row0" >female</th>
<td id="T_be2cfb00_1ebd_11eb_af08_0242ac1c0002row0_col0" class="data row0 col0" >0</td>
<td id="T_be2cfb00_1ebd_11eb_af08_0242ac1c0002row0_col1" class="data row0 col1" >0</td>
<td id="T_be2cfb00_1ebd_11eb_af08_0242ac1c0002row0_col2" class="data row0 col2" >1</td>
<td id="T_be2cfb00_1ebd_11eb_af08_0242ac1c0002row0_col3" class="data row0 col3" >0</td>
<td id="T_be2cfb00_1ebd_11eb_af08_0242ac1c0002row0_col4" class="data row0 col4" >1</td>
<td id="T_be2cfb00_1ebd_11eb_af08_0242ac1c0002row0_col5" class="data row0 col5" >0</td>
<td id="T_be2cfb00_1ebd_11eb_af08_0242ac1c0002row0_col6" class="data row0 col6" >1</td>
<td id="T_be2cfb00_1ebd_11eb_af08_0242ac1c0002row0_col7" class="data row0 col7" >0</td>
<td id="T_be2cfb00_1ebd_11eb_af08_0242ac1c0002row0_col8" class="data row0 col8" >0</td>
<td id="T_be2cfb00_1ebd_11eb_af08_0242ac1c0002row0_col9" class="data row0 col9" >182</td>
<td id="T_be2cfb00_1ebd_11eb_af08_0242ac1c0002row0_col10" class="data row0 col10" >2</td>
<td id="T_be2cfb00_1ebd_11eb_af08_0242ac1c0002row0_col11" class="data row0 col11" >1</td>
<td id="T_be2cfb00_1ebd_11eb_af08_0242ac1c0002row0_col12" class="data row0 col12" >0</td>
<td id="T_be2cfb00_1ebd_11eb_af08_0242ac1c0002row0_col13" class="data row0 col13" >125</td>
<td id="T_be2cfb00_1ebd_11eb_af08_0242ac1c0002row0_col14" class="data row0 col14" >1</td>
<td id="T_be2cfb00_1ebd_11eb_af08_0242ac1c0002row0_col15" class="data row0 col15" >0</td>
<td id="T_be2cfb00_1ebd_11eb_af08_0242ac1c0002row0_col16" class="data row0 col16" >0</td>
</tr>
<tr>
<th id="T_be2cfb00_1ebd_11eb_af08_0242ac1c0002level0_row1" class="row_heading level0 row1" >male</th>
<td id="T_be2cfb00_1ebd_11eb_af08_0242ac1c0002row1_col0" class="data row1 col0" >1</td>
<td id="T_be2cfb00_1ebd_11eb_af08_0242ac1c0002row1_col1" class="data row1 col1" >2</td>
<td id="T_be2cfb00_1ebd_11eb_af08_0242ac1c0002row1_col2" class="data row1 col2" >0</td>
<td id="T_be2cfb00_1ebd_11eb_af08_0242ac1c0002row1_col3" class="data row1 col3" >1</td>
<td id="T_be2cfb00_1ebd_11eb_af08_0242ac1c0002row1_col4" class="data row1 col4" >6</td>
<td id="T_be2cfb00_1ebd_11eb_af08_0242ac1c0002row1_col5" class="data row1 col5" >1</td>
<td id="T_be2cfb00_1ebd_11eb_af08_0242ac1c0002row1_col6" class="data row1 col6" >0</td>
<td id="T_be2cfb00_1ebd_11eb_af08_0242ac1c0002row1_col7" class="data row1 col7" >2</td>
<td id="T_be2cfb00_1ebd_11eb_af08_0242ac1c0002row1_col8" class="data row1 col8" >40</td>
<td id="T_be2cfb00_1ebd_11eb_af08_0242ac1c0002row1_col9" class="data row1 col9" >0</td>
<td id="T_be2cfb00_1ebd_11eb_af08_0242ac1c0002row1_col10" class="data row1 col10" >0</td>
<td id="T_be2cfb00_1ebd_11eb_af08_0242ac1c0002row1_col11" class="data row1 col11" >0</td>
<td id="T_be2cfb00_1ebd_11eb_af08_0242ac1c0002row1_col12" class="data row1 col12" >517</td>
<td id="T_be2cfb00_1ebd_11eb_af08_0242ac1c0002row1_col13" class="data row1 col13" >0</td>
<td id="T_be2cfb00_1ebd_11eb_af08_0242ac1c0002row1_col14" class="data row1 col14" >0</td>
<td id="T_be2cfb00_1ebd_11eb_af08_0242ac1c0002row1_col15" class="data row1 col15" >6</td>
<td id="T_be2cfb00_1ebd_11eb_af08_0242ac1c0002row1_col16" class="data row1 col16" >1</td>
</tr>
</tbody></table>좋다. 위를 보면 mlle이나 Mme와 같은 철자가 틀린 이니셜이 있는데 이는 Miss를 나타낸다. 나는 그것들을 미스나 다른 가치에 대해서도 같은 것으로 대체할 것이다.
1 data['Initial' ].replace(['Mlle' ,'Mme' ,'Ms' ,'Dr' ,'Major' ,'Lady' ,'Countess' ,'Jonkheer' ,'Col' ,'Rev' ,'Capt' ,'Sir' ,'Don' ],['Miss' ,'Miss' ,'Miss' ,'Mr' ,'Mr' ,'Mrs' ,'Mrs' ,'Other' ,'Other' ,'Other' ,'Mr' ,'Mr' ,'Mr' ],inplace=True )
1 data.groupby('Initial' )['Age' ].mean()
Initial
Master 4.574167
Miss 21.860000
Mr 32.739609
Mrs 35.981818
Other 45.888889
Name: Age, dtype: float64나이 결측치 채워주기
1 2 3 4 5 6 data.loc[(data.Age.isnull())&(data.Initial=='Mr' ),'Age' ]=33 data.loc[(data.Age.isnull())&(data.Initial=='Mrs' ),'Age' ]=36 data.loc[(data.Age.isnull())&(data.Initial=='Master' ),'Age' ]=5 data.loc[(data.Age.isnull())&(data.Initial=='Miss' ),'Age' ]=22 data.loc[(data.Age.isnull())&(data.Initial=='Other' ),'Age' ]=46
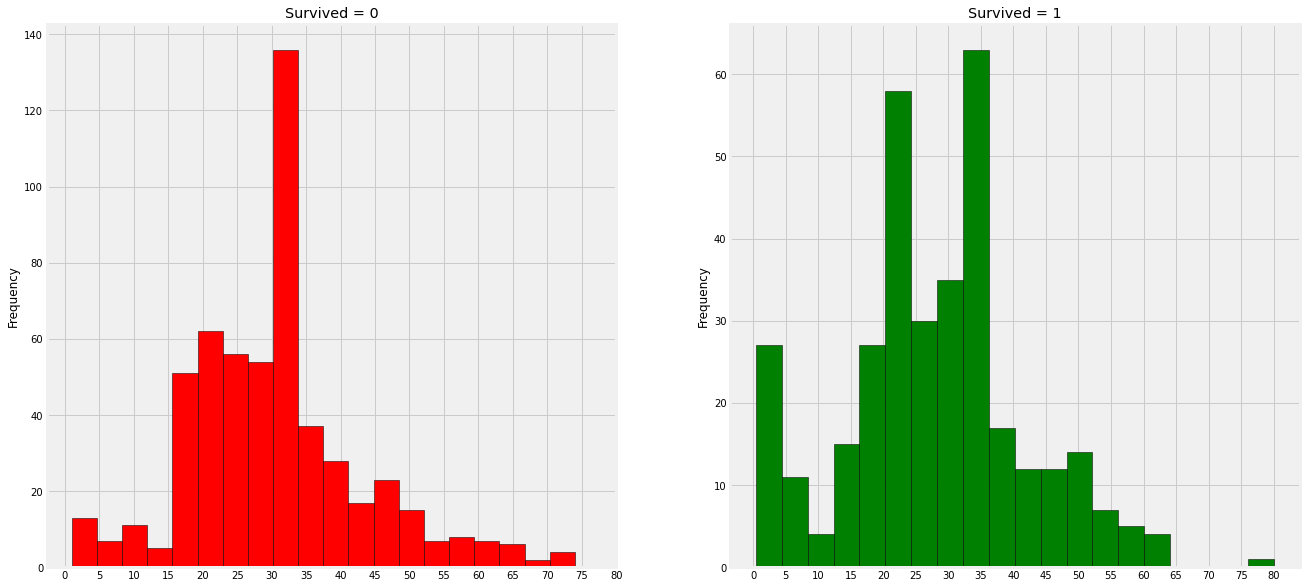
False1 2 3 4 5 6 7 8 9 10 f,ax=plt.subplots(1 ,2 ,figsize=(20 ,10 )) data[data['Survived' ]==0 ].Age.plot.hist(ax=ax[0 ],bins=20 , edgecolor='black' , color='red' ) ax[0 ].set_title('Survived = 0' ) x1= list (range (0 ,85 ,5 )) ax[0 ].set_xticks(x1) data[data['Survived' ]==1 ].Age.plot.hist(ax=ax[1 ], color='green' , bins=20 , edgecolor='black' ) ax[1 ].set_title('Survived = 1' ) x2=list (range (0 ,85 ,5 )) ax[1 ].set_xticks(x2) plt.show()
관찰일지)
5세 미만의 아기들은 상당 수 구조되었다.
가장 나이가 많은 승객은 구조되었다.
가장 사망자 수가 많은 나이대는 30~40세이다.
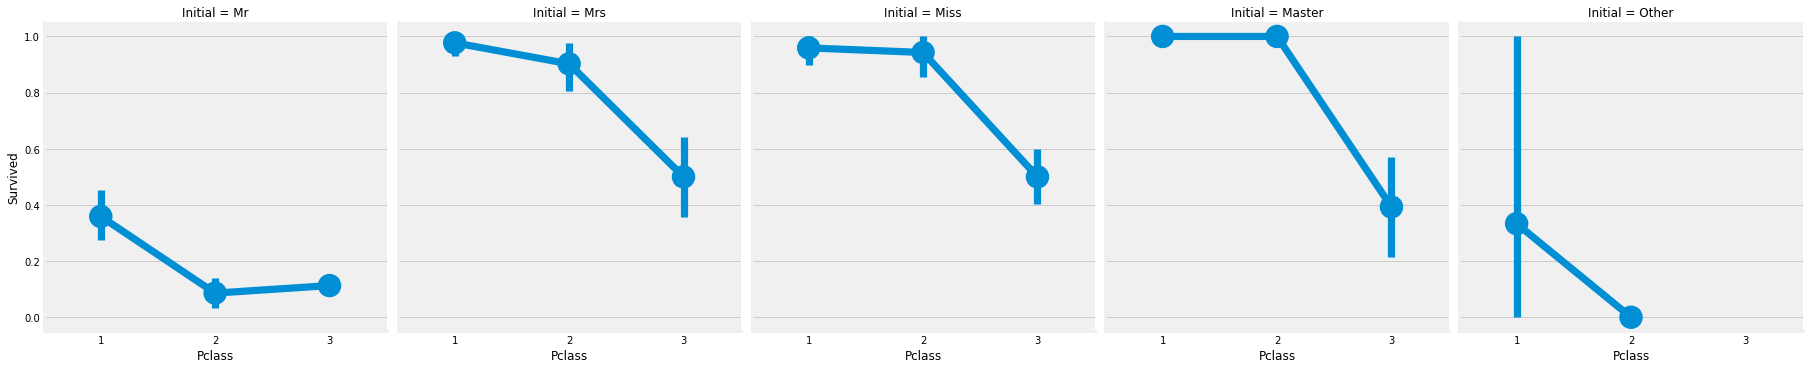
1 2 sns.factorplot('Pclass' , 'Survived' , col = 'Initial' , data = data) plt.show()
따라서 부녀자 우선 구조 정책은 계층에 관계없이 적용된다.
승선 - > 범주형 데이터
1 pd.crosstab([data.Embarked, data.Pclass],[data.Sex, data.Survived], margins=True ).style.background_gradient(cmap='summer_r' )
Sex female male All Survived 0 1 0 1 Embarked Pclass
<tr>
<th id="T_bf440862_1ebd_11eb_af08_0242ac1c0002level0_row0" class="row_heading level0 row0" rowspan=3>C</th>
<th id="T_bf440862_1ebd_11eb_af08_0242ac1c0002level1_row0" class="row_heading level1 row0" >1</th>
<td id="T_bf440862_1ebd_11eb_af08_0242ac1c0002row0_col0" class="data row0 col0" >1</td>
<td id="T_bf440862_1ebd_11eb_af08_0242ac1c0002row0_col1" class="data row0 col1" >42</td>
<td id="T_bf440862_1ebd_11eb_af08_0242ac1c0002row0_col2" class="data row0 col2" >25</td>
<td id="T_bf440862_1ebd_11eb_af08_0242ac1c0002row0_col3" class="data row0 col3" >17</td>
<td id="T_bf440862_1ebd_11eb_af08_0242ac1c0002row0_col4" class="data row0 col4" >85</td>
</tr>
<tr>
<th id="T_bf440862_1ebd_11eb_af08_0242ac1c0002level1_row1" class="row_heading level1 row1" >2</th>
<td id="T_bf440862_1ebd_11eb_af08_0242ac1c0002row1_col0" class="data row1 col0" >0</td>
<td id="T_bf440862_1ebd_11eb_af08_0242ac1c0002row1_col1" class="data row1 col1" >7</td>
<td id="T_bf440862_1ebd_11eb_af08_0242ac1c0002row1_col2" class="data row1 col2" >8</td>
<td id="T_bf440862_1ebd_11eb_af08_0242ac1c0002row1_col3" class="data row1 col3" >2</td>
<td id="T_bf440862_1ebd_11eb_af08_0242ac1c0002row1_col4" class="data row1 col4" >17</td>
</tr>
<tr>
<th id="T_bf440862_1ebd_11eb_af08_0242ac1c0002level1_row2" class="row_heading level1 row2" >3</th>
<td id="T_bf440862_1ebd_11eb_af08_0242ac1c0002row2_col0" class="data row2 col0" >8</td>
<td id="T_bf440862_1ebd_11eb_af08_0242ac1c0002row2_col1" class="data row2 col1" >15</td>
<td id="T_bf440862_1ebd_11eb_af08_0242ac1c0002row2_col2" class="data row2 col2" >33</td>
<td id="T_bf440862_1ebd_11eb_af08_0242ac1c0002row2_col3" class="data row2 col3" >10</td>
<td id="T_bf440862_1ebd_11eb_af08_0242ac1c0002row2_col4" class="data row2 col4" >66</td>
</tr>
<tr>
<th id="T_bf440862_1ebd_11eb_af08_0242ac1c0002level0_row3" class="row_heading level0 row3" rowspan=3>Q</th>
<th id="T_bf440862_1ebd_11eb_af08_0242ac1c0002level1_row3" class="row_heading level1 row3" >1</th>
<td id="T_bf440862_1ebd_11eb_af08_0242ac1c0002row3_col0" class="data row3 col0" >0</td>
<td id="T_bf440862_1ebd_11eb_af08_0242ac1c0002row3_col1" class="data row3 col1" >1</td>
<td id="T_bf440862_1ebd_11eb_af08_0242ac1c0002row3_col2" class="data row3 col2" >1</td>
<td id="T_bf440862_1ebd_11eb_af08_0242ac1c0002row3_col3" class="data row3 col3" >0</td>
<td id="T_bf440862_1ebd_11eb_af08_0242ac1c0002row3_col4" class="data row3 col4" >2</td>
</tr>
<tr>
<th id="T_bf440862_1ebd_11eb_af08_0242ac1c0002level1_row4" class="row_heading level1 row4" >2</th>
<td id="T_bf440862_1ebd_11eb_af08_0242ac1c0002row4_col0" class="data row4 col0" >0</td>
<td id="T_bf440862_1ebd_11eb_af08_0242ac1c0002row4_col1" class="data row4 col1" >2</td>
<td id="T_bf440862_1ebd_11eb_af08_0242ac1c0002row4_col2" class="data row4 col2" >1</td>
<td id="T_bf440862_1ebd_11eb_af08_0242ac1c0002row4_col3" class="data row4 col3" >0</td>
<td id="T_bf440862_1ebd_11eb_af08_0242ac1c0002row4_col4" class="data row4 col4" >3</td>
</tr>
<tr>
<th id="T_bf440862_1ebd_11eb_af08_0242ac1c0002level1_row5" class="row_heading level1 row5" >3</th>
<td id="T_bf440862_1ebd_11eb_af08_0242ac1c0002row5_col0" class="data row5 col0" >9</td>
<td id="T_bf440862_1ebd_11eb_af08_0242ac1c0002row5_col1" class="data row5 col1" >24</td>
<td id="T_bf440862_1ebd_11eb_af08_0242ac1c0002row5_col2" class="data row5 col2" >36</td>
<td id="T_bf440862_1ebd_11eb_af08_0242ac1c0002row5_col3" class="data row5 col3" >3</td>
<td id="T_bf440862_1ebd_11eb_af08_0242ac1c0002row5_col4" class="data row5 col4" >72</td>
</tr>
<tr>
<th id="T_bf440862_1ebd_11eb_af08_0242ac1c0002level0_row6" class="row_heading level0 row6" rowspan=3>S</th>
<th id="T_bf440862_1ebd_11eb_af08_0242ac1c0002level1_row6" class="row_heading level1 row6" >1</th>
<td id="T_bf440862_1ebd_11eb_af08_0242ac1c0002row6_col0" class="data row6 col0" >2</td>
<td id="T_bf440862_1ebd_11eb_af08_0242ac1c0002row6_col1" class="data row6 col1" >46</td>
<td id="T_bf440862_1ebd_11eb_af08_0242ac1c0002row6_col2" class="data row6 col2" >51</td>
<td id="T_bf440862_1ebd_11eb_af08_0242ac1c0002row6_col3" class="data row6 col3" >28</td>
<td id="T_bf440862_1ebd_11eb_af08_0242ac1c0002row6_col4" class="data row6 col4" >127</td>
</tr>
<tr>
<th id="T_bf440862_1ebd_11eb_af08_0242ac1c0002level1_row7" class="row_heading level1 row7" >2</th>
<td id="T_bf440862_1ebd_11eb_af08_0242ac1c0002row7_col0" class="data row7 col0" >6</td>
<td id="T_bf440862_1ebd_11eb_af08_0242ac1c0002row7_col1" class="data row7 col1" >61</td>
<td id="T_bf440862_1ebd_11eb_af08_0242ac1c0002row7_col2" class="data row7 col2" >82</td>
<td id="T_bf440862_1ebd_11eb_af08_0242ac1c0002row7_col3" class="data row7 col3" >15</td>
<td id="T_bf440862_1ebd_11eb_af08_0242ac1c0002row7_col4" class="data row7 col4" >164</td>
</tr>
<tr>
<th id="T_bf440862_1ebd_11eb_af08_0242ac1c0002level1_row8" class="row_heading level1 row8" >3</th>
<td id="T_bf440862_1ebd_11eb_af08_0242ac1c0002row8_col0" class="data row8 col0" >55</td>
<td id="T_bf440862_1ebd_11eb_af08_0242ac1c0002row8_col1" class="data row8 col1" >33</td>
<td id="T_bf440862_1ebd_11eb_af08_0242ac1c0002row8_col2" class="data row8 col2" >231</td>
<td id="T_bf440862_1ebd_11eb_af08_0242ac1c0002row8_col3" class="data row8 col3" >34</td>
<td id="T_bf440862_1ebd_11eb_af08_0242ac1c0002row8_col4" class="data row8 col4" >353</td>
</tr>
<tr>
<th id="T_bf440862_1ebd_11eb_af08_0242ac1c0002level0_row9" class="row_heading level0 row9" >All</th>
<th id="T_bf440862_1ebd_11eb_af08_0242ac1c0002level1_row9" class="row_heading level1 row9" ></th>
<td id="T_bf440862_1ebd_11eb_af08_0242ac1c0002row9_col0" class="data row9 col0" >81</td>
<td id="T_bf440862_1ebd_11eb_af08_0242ac1c0002row9_col1" class="data row9 col1" >231</td>
<td id="T_bf440862_1ebd_11eb_af08_0242ac1c0002row9_col2" class="data row9 col2" >468</td>
<td id="T_bf440862_1ebd_11eb_af08_0242ac1c0002row9_col3" class="data row9 col3" >109</td>
<td id="T_bf440862_1ebd_11eb_af08_0242ac1c0002row9_col4" class="data row9 col4" >889</td>
</tr>
</tbody></table>항만별 생존 가능성
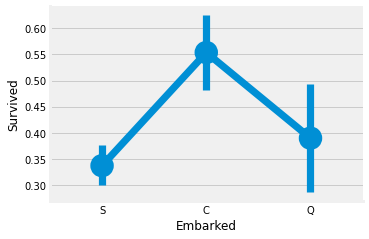
1 2 3 4 sns.factorplot('Embarked' , 'Survived' , data=data) fig=plt.gcf() fig.set_size_inches(5 ,3 ) plt.show()
C항만에서 승선한 사람들이 가장 생존률이 높았고, S항만에서 승선한 사람들이 가장 낮았다.
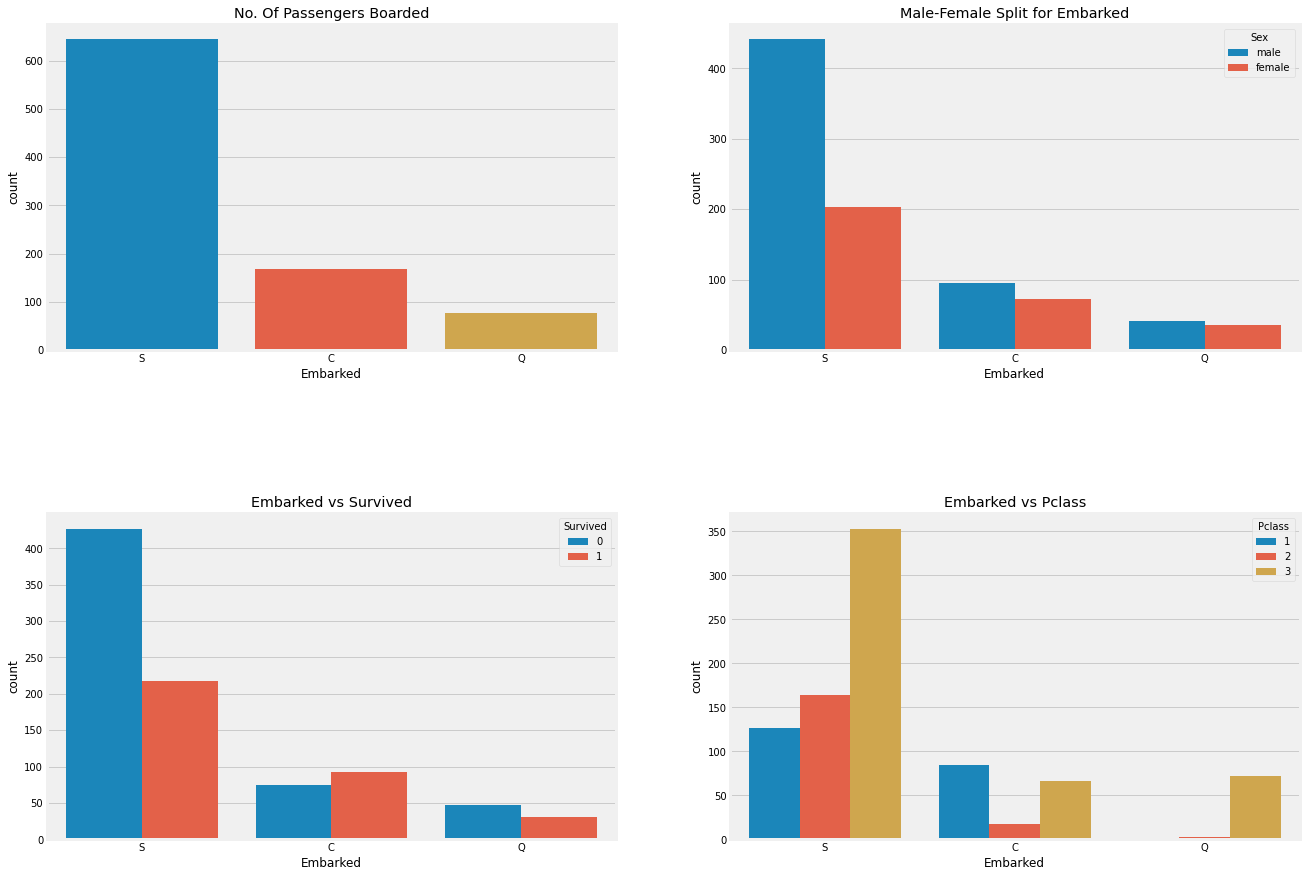
1 2 3 4 5 6 7 8 9 10 11 f,ax = plt.subplots(2 ,2 ,figsize=(20 ,15 )) sns.countplot('Embarked' , data=data, ax=ax[0 ,0 ]) ax[0 ,0 ].set_title('No. Of Passengers Boarded' ) sns.countplot('Embarked' , hue='Sex' , data=data, ax=ax[0 ,1 ]) ax[0 ,1 ].set_title('Male-Female Split for Embarked' ) sns.countplot('Embarked' , hue='Survived' , data=data, ax=ax[1 ,0 ]) ax[1 ,0 ].set_title('Embarked vs Survived' ) sns.countplot('Embarked' , hue='Pclass' , data=data, ax=ax[1 ,1 ]) ax[1 ,1 ].set_title('Embarked vs Pclass' ) plt.subplots_adjust(wspace=0.2 , hspace=0.5 ) plt.show()
관찰결과:
최다 승선을 한 항만은 S항만이며 주된 객실은 3등급 객실이었다.
C항만에서 승선한 승객들은 운이 좋은 것으로 보이는 데 그 이유는 1, 2등급 객실 승객을 우선 구조했기 때문이다.
S항만의 승객들은 주로 부자들이 승선한 것으로 보인다. 하지만 여전히 생존률은 낮다, 왜냐하면 3등급 객실 승객의 81%가 살아남지 못했기 때문이다.
Q항만은 대부분 3등급 객실의 고객으로 이루어져있다.
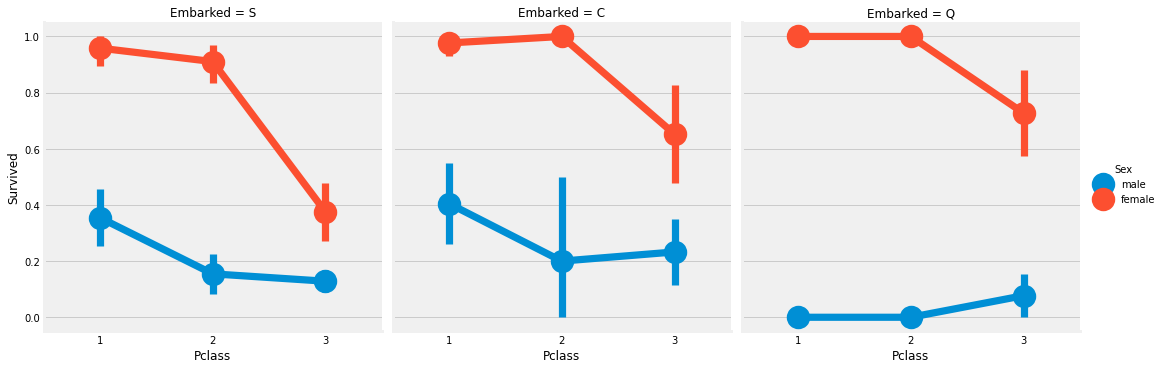
1 2 3 sns.factorplot('Pclass' , 'Survived' , hue='Sex' , col='Embarked' , data=data) plt.show()
관찰결과 :
1등급 객실과 2등급 객실의 여성은 객실 등급에 관계없이 생존률은 거의 1에 가깝다.
S항만의 사람들은 남녀 모두에서 3등급 객실에 사람들이 생존률이 매우 낮은 걸로 보아 운이 나쁘다할 수 있다.
Q항만은 거의 모두가 3등급 객실에서 온 것으로 보아 남성에게는 맞지 않는 항만같다.
항만(Enbarked) 결측치 채워주기
우리는 많은 승객들이 S항만에서 탑승한 것을 통해 결측치에 S항만의 값을 넣어준다.
1 data['Embarked' ].fillna('S' ,inplace=True )
1 data.Embarked.isnull().any ()
FalseSibSip -> 이산형 변수
이 변수는 혼자 온 고객 또는 가족과 함께 온 고객을 구분한다.
Sibling = brother, sister, stepbrother, stepsister
Spouse = husband, wife
1 pd.crosstab([data.SibSp],data.Survived).style.background_gradient(cmap='summer_r' )
Survived 0 1 SibSp
<tr>
<th id="T_c0724604_1ebd_11eb_af08_0242ac1c0002level0_row0" class="row_heading level0 row0" >0</th>
<td id="T_c0724604_1ebd_11eb_af08_0242ac1c0002row0_col0" class="data row0 col0" >398</td>
<td id="T_c0724604_1ebd_11eb_af08_0242ac1c0002row0_col1" class="data row0 col1" >210</td>
</tr>
<tr>
<th id="T_c0724604_1ebd_11eb_af08_0242ac1c0002level0_row1" class="row_heading level0 row1" >1</th>
<td id="T_c0724604_1ebd_11eb_af08_0242ac1c0002row1_col0" class="data row1 col0" >97</td>
<td id="T_c0724604_1ebd_11eb_af08_0242ac1c0002row1_col1" class="data row1 col1" >112</td>
</tr>
<tr>
<th id="T_c0724604_1ebd_11eb_af08_0242ac1c0002level0_row2" class="row_heading level0 row2" >2</th>
<td id="T_c0724604_1ebd_11eb_af08_0242ac1c0002row2_col0" class="data row2 col0" >15</td>
<td id="T_c0724604_1ebd_11eb_af08_0242ac1c0002row2_col1" class="data row2 col1" >13</td>
</tr>
<tr>
<th id="T_c0724604_1ebd_11eb_af08_0242ac1c0002level0_row3" class="row_heading level0 row3" >3</th>
<td id="T_c0724604_1ebd_11eb_af08_0242ac1c0002row3_col0" class="data row3 col0" >12</td>
<td id="T_c0724604_1ebd_11eb_af08_0242ac1c0002row3_col1" class="data row3 col1" >4</td>
</tr>
<tr>
<th id="T_c0724604_1ebd_11eb_af08_0242ac1c0002level0_row4" class="row_heading level0 row4" >4</th>
<td id="T_c0724604_1ebd_11eb_af08_0242ac1c0002row4_col0" class="data row4 col0" >15</td>
<td id="T_c0724604_1ebd_11eb_af08_0242ac1c0002row4_col1" class="data row4 col1" >3</td>
</tr>
<tr>
<th id="T_c0724604_1ebd_11eb_af08_0242ac1c0002level0_row5" class="row_heading level0 row5" >5</th>
<td id="T_c0724604_1ebd_11eb_af08_0242ac1c0002row5_col0" class="data row5 col0" >5</td>
<td id="T_c0724604_1ebd_11eb_af08_0242ac1c0002row5_col1" class="data row5 col1" >0</td>
</tr>
<tr>
<th id="T_c0724604_1ebd_11eb_af08_0242ac1c0002level0_row6" class="row_heading level0 row6" >8</th>
<td id="T_c0724604_1ebd_11eb_af08_0242ac1c0002row6_col0" class="data row6 col0" >7</td>
<td id="T_c0724604_1ebd_11eb_af08_0242ac1c0002row6_col1" class="data row6 col1" >0</td>
</tr>
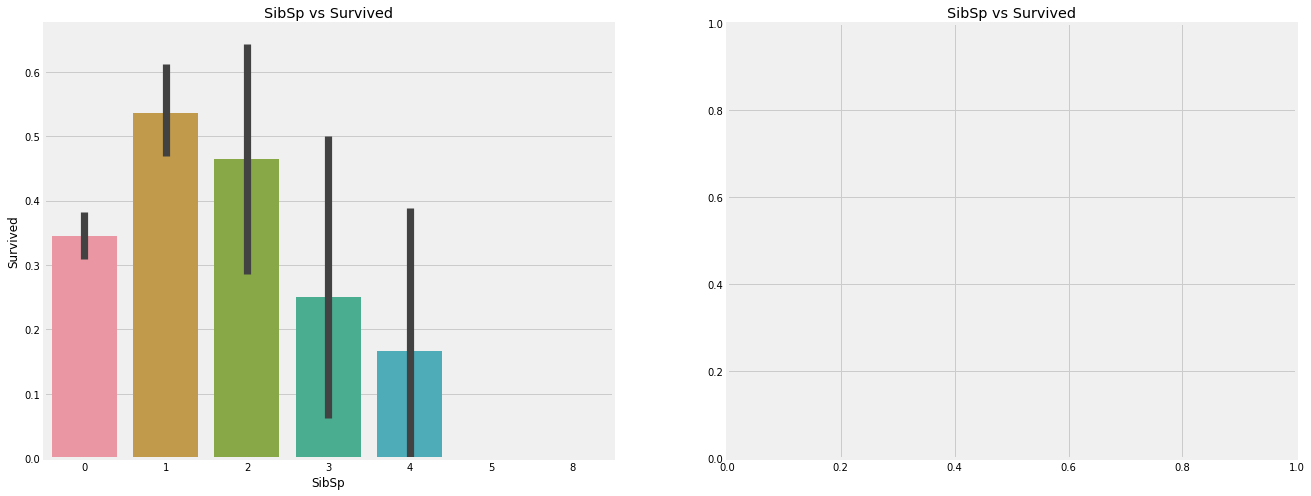
</tbody></table>1 2 3 4 5 6 7 f,ax=plt.subplots(1 ,2 ,figsize=(20 ,8 )) sns.barplot('SibSp' ,'Survived' ,data=data,ax=ax[0 ]) ax[0 ].set_title('SibSp vs Survived' ) sns.factorplot('SibSp' ,'Survived' ,data=data,ax=ax[1 ]) ax[1 ].set_title('SibSp vs Survived' ) plt.close(2 ) plt.show()
1 pd.crosstab(data.SibSp, data.Pclass).style.background_gradient(cmap='summer_r' )
Pclass 1 2 3 SibSp
<tr>
<th id="T_3093142c_1ebe_11eb_af08_0242ac1c0002level0_row0" class="row_heading level0 row0" >0</th>
<td id="T_3093142c_1ebe_11eb_af08_0242ac1c0002row0_col0" class="data row0 col0" >137</td>
<td id="T_3093142c_1ebe_11eb_af08_0242ac1c0002row0_col1" class="data row0 col1" >120</td>
<td id="T_3093142c_1ebe_11eb_af08_0242ac1c0002row0_col2" class="data row0 col2" >351</td>
</tr>
<tr>
<th id="T_3093142c_1ebe_11eb_af08_0242ac1c0002level0_row1" class="row_heading level0 row1" >1</th>
<td id="T_3093142c_1ebe_11eb_af08_0242ac1c0002row1_col0" class="data row1 col0" >71</td>
<td id="T_3093142c_1ebe_11eb_af08_0242ac1c0002row1_col1" class="data row1 col1" >55</td>
<td id="T_3093142c_1ebe_11eb_af08_0242ac1c0002row1_col2" class="data row1 col2" >83</td>
</tr>
<tr>
<th id="T_3093142c_1ebe_11eb_af08_0242ac1c0002level0_row2" class="row_heading level0 row2" >2</th>
<td id="T_3093142c_1ebe_11eb_af08_0242ac1c0002row2_col0" class="data row2 col0" >5</td>
<td id="T_3093142c_1ebe_11eb_af08_0242ac1c0002row2_col1" class="data row2 col1" >8</td>
<td id="T_3093142c_1ebe_11eb_af08_0242ac1c0002row2_col2" class="data row2 col2" >15</td>
</tr>
<tr>
<th id="T_3093142c_1ebe_11eb_af08_0242ac1c0002level0_row3" class="row_heading level0 row3" >3</th>
<td id="T_3093142c_1ebe_11eb_af08_0242ac1c0002row3_col0" class="data row3 col0" >3</td>
<td id="T_3093142c_1ebe_11eb_af08_0242ac1c0002row3_col1" class="data row3 col1" >1</td>
<td id="T_3093142c_1ebe_11eb_af08_0242ac1c0002row3_col2" class="data row3 col2" >12</td>
</tr>
<tr>
<th id="T_3093142c_1ebe_11eb_af08_0242ac1c0002level0_row4" class="row_heading level0 row4" >4</th>
<td id="T_3093142c_1ebe_11eb_af08_0242ac1c0002row4_col0" class="data row4 col0" >0</td>
<td id="T_3093142c_1ebe_11eb_af08_0242ac1c0002row4_col1" class="data row4 col1" >0</td>
<td id="T_3093142c_1ebe_11eb_af08_0242ac1c0002row4_col2" class="data row4 col2" >18</td>
</tr>
<tr>
<th id="T_3093142c_1ebe_11eb_af08_0242ac1c0002level0_row5" class="row_heading level0 row5" >5</th>
<td id="T_3093142c_1ebe_11eb_af08_0242ac1c0002row5_col0" class="data row5 col0" >0</td>
<td id="T_3093142c_1ebe_11eb_af08_0242ac1c0002row5_col1" class="data row5 col1" >0</td>
<td id="T_3093142c_1ebe_11eb_af08_0242ac1c0002row5_col2" class="data row5 col2" >5</td>
</tr>
<tr>
<th id="T_3093142c_1ebe_11eb_af08_0242ac1c0002level0_row6" class="row_heading level0 row6" >8</th>
<td id="T_3093142c_1ebe_11eb_af08_0242ac1c0002row6_col0" class="data row6 col0" >0</td>
<td id="T_3093142c_1ebe_11eb_af08_0242ac1c0002row6_col1" class="data row6 col1" >0</td>
<td id="T_3093142c_1ebe_11eb_af08_0242ac1c0002row6_col2" class="data row6 col2" >7</td>
</tr>
</tbody></table>관찰결과 :
위 barplot과 factorplot은 가족의 수가 많아질 수록 생존률이 낮아지는 것을 확인할 수 있다. 이는 가족이 많아질 수록 자신을 챙기지 않고 가족을 챙기려는 경향이 생기기 때문일 거라 유추된다.
Parch
1 pd.crosstab(data.Parch, data.Pclass).style.background_gradient(cmap='summer_r' )
Pclass 1 2 3 Parch
<tr>
<th id="T_d967ea50_1ebe_11eb_af08_0242ac1c0002level0_row0" class="row_heading level0 row0" >0</th>
<td id="T_d967ea50_1ebe_11eb_af08_0242ac1c0002row0_col0" class="data row0 col0" >163</td>
<td id="T_d967ea50_1ebe_11eb_af08_0242ac1c0002row0_col1" class="data row0 col1" >134</td>
<td id="T_d967ea50_1ebe_11eb_af08_0242ac1c0002row0_col2" class="data row0 col2" >381</td>
</tr>
<tr>
<th id="T_d967ea50_1ebe_11eb_af08_0242ac1c0002level0_row1" class="row_heading level0 row1" >1</th>
<td id="T_d967ea50_1ebe_11eb_af08_0242ac1c0002row1_col0" class="data row1 col0" >31</td>
<td id="T_d967ea50_1ebe_11eb_af08_0242ac1c0002row1_col1" class="data row1 col1" >32</td>
<td id="T_d967ea50_1ebe_11eb_af08_0242ac1c0002row1_col2" class="data row1 col2" >55</td>
</tr>
<tr>
<th id="T_d967ea50_1ebe_11eb_af08_0242ac1c0002level0_row2" class="row_heading level0 row2" >2</th>
<td id="T_d967ea50_1ebe_11eb_af08_0242ac1c0002row2_col0" class="data row2 col0" >21</td>
<td id="T_d967ea50_1ebe_11eb_af08_0242ac1c0002row2_col1" class="data row2 col1" >16</td>
<td id="T_d967ea50_1ebe_11eb_af08_0242ac1c0002row2_col2" class="data row2 col2" >43</td>
</tr>
<tr>
<th id="T_d967ea50_1ebe_11eb_af08_0242ac1c0002level0_row3" class="row_heading level0 row3" >3</th>
<td id="T_d967ea50_1ebe_11eb_af08_0242ac1c0002row3_col0" class="data row3 col0" >0</td>
<td id="T_d967ea50_1ebe_11eb_af08_0242ac1c0002row3_col1" class="data row3 col1" >2</td>
<td id="T_d967ea50_1ebe_11eb_af08_0242ac1c0002row3_col2" class="data row3 col2" >3</td>
</tr>
<tr>
<th id="T_d967ea50_1ebe_11eb_af08_0242ac1c0002level0_row4" class="row_heading level0 row4" >4</th>
<td id="T_d967ea50_1ebe_11eb_af08_0242ac1c0002row4_col0" class="data row4 col0" >1</td>
<td id="T_d967ea50_1ebe_11eb_af08_0242ac1c0002row4_col1" class="data row4 col1" >0</td>
<td id="T_d967ea50_1ebe_11eb_af08_0242ac1c0002row4_col2" class="data row4 col2" >3</td>
</tr>
<tr>
<th id="T_d967ea50_1ebe_11eb_af08_0242ac1c0002level0_row5" class="row_heading level0 row5" >5</th>
<td id="T_d967ea50_1ebe_11eb_af08_0242ac1c0002row5_col0" class="data row5 col0" >0</td>
<td id="T_d967ea50_1ebe_11eb_af08_0242ac1c0002row5_col1" class="data row5 col1" >0</td>
<td id="T_d967ea50_1ebe_11eb_af08_0242ac1c0002row5_col2" class="data row5 col2" >5</td>
</tr>
<tr>
<th id="T_d967ea50_1ebe_11eb_af08_0242ac1c0002level0_row6" class="row_heading level0 row6" >6</th>
<td id="T_d967ea50_1ebe_11eb_af08_0242ac1c0002row6_col0" class="data row6 col0" >0</td>
<td id="T_d967ea50_1ebe_11eb_af08_0242ac1c0002row6_col1" class="data row6 col1" >0</td>
<td id="T_d967ea50_1ebe_11eb_af08_0242ac1c0002row6_col2" class="data row6 col2" >1</td>
</tr>
</tbody></table>크로스탭은 3등급 객실에 많은 수의 가족단위 승객이 탓다는 것을 보여준다.
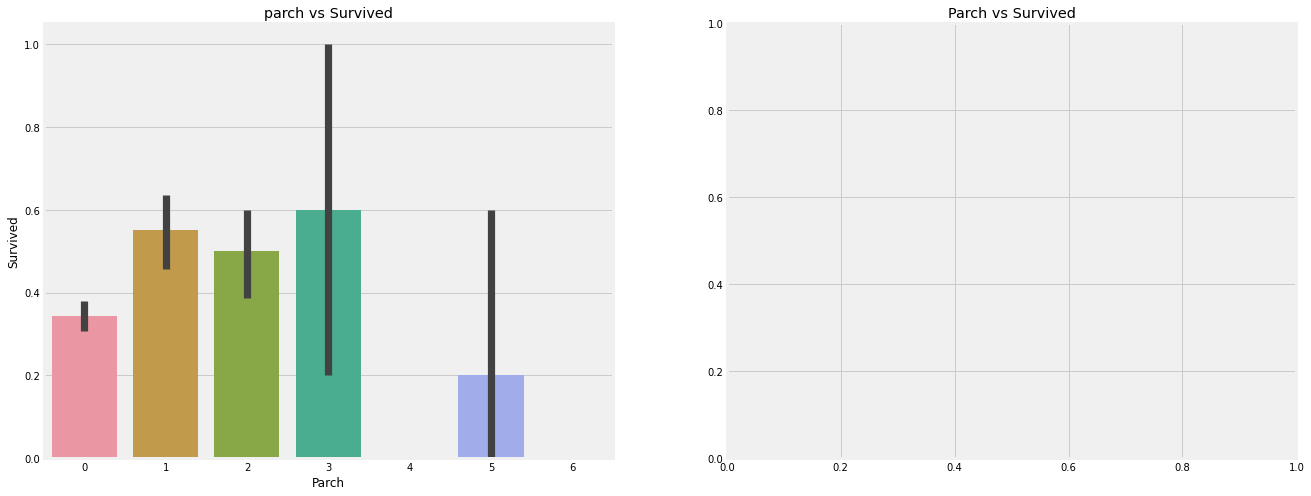
1 2 3 4 5 6 7 f,ax=plt.subplots(1 ,2 ,figsize=(20 ,8 )) sns.barplot('Parch' , 'Survived' , data=data, ax=ax[0 ]) ax[0 ].set_title('parch vs Survived' ) sns.factorplot('Parch' , 'Survived' , data=data, ax=ax[1 ]) ax[1 ].set_title('Parch vs Survived' ) plt.close(2 ) plt.show()
관찰결과 :
부모를 동반한 승객은 생존 가능성이 더 크다. 하지만 가족의 숫자가 늘어날 수록 생존가능성은 줄어든다.
생존 가능성은 배 안에 1~3명의 부모를 둔 사람에게 좋다. 혼자라는 것은 또한 치명적이고 누군가가 배에 4명 이상의 부모를 두고 있을 때 생존 가능성은 줄어든다.
You need to set install_url to use ShareThis. Please set it in _config.yml.
Comments You forgot to set the shortname for Disqus. Please set it in _config.yml.